Manipur Population 2025
Manipur is the northern eastern state in India, bordered by Assam to the west, Nagaland to the north, Mizoram to the south and Myanmar to the east. In Manipur, The hilly areas constitute about 90% of the total geographical area and the total area occupied by all lakes is around 600 sq km. Manipur population in 2025 is estimated to be 3.26 million (32.6 Lakhs), By Aug 2023, Manipur population is projected to be 32.23 Lakhs as per Unique Identification Aadhar India, updated 31, May 2023. As per NFHS 2019-2021 report, Total Fertility Rate of Manipur State is 2.2 children per women compared to 2.6 in 2016. Manipur is the 24th populous state in India, and the total area of Manipur is 22,327 sq km and ranks 24th largest state. The majority and main ethnic group of Manipur is Meitei, where they settled central plain part of Manipur is the majority of the Manipur state population. Manipuri language is natively called Meitei, is the most spoken language of Manipur. Other tribals include Naga and Kuki. Manipur rich in art and tradition "Mani" means jewels or gems, "pur' means land, which is land of gems. Meiteis account for about 53 per cent of the state's population and they live mostly in the Imphal Valley, while tribals, which include Nagas and Kukis which constitute of about 40 percent, reside mostly in the hill districts. The popular lake is Loktak lake, largest freshwater lake in north-eastern India in the region of Mooirang with 35 km of length and 13 km of width, and its famous for phumdis. Manipur was known by different names at various periods of the history, Some of the popular names during different centuries are Tilli-Koktong, Sanna-Leipak, Poirei-Lam, Mitei-Leipak, Meitrabak or Manipur (currently). Agriculture is the main occupation of Manipur besides Horticulture.
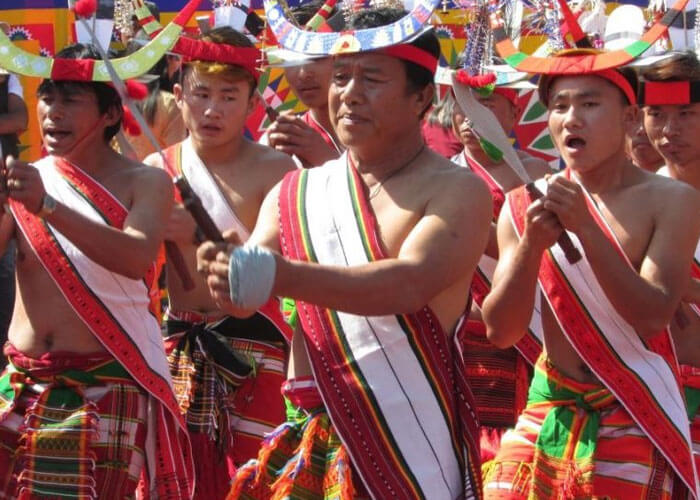
Image Source: Tanghul Nagas of Manipur population celebrating Chumpha Festival
| Census year | Persons | Absolute | Percentage | Males | Females |
|---|---|---|---|---|---|
| 1901 | 284,465 | - | - | 139,632 | 144,833 |
| 1911 | 346,222 | 61,757 | 21.71 | 170,666 | 175,556 |
| 1921 | 384,016 | 37,794 | 10.92 | 188,119 | 195,897 |
| 1931 | 445,606 | 61,590 | 16.04 | 215,815 | 229,791 |
| 1941 | 512,069 | 66,463 | 14.92 | 249,183 | 262,886 |
| 1951 | 577,635 | 65,566 | 12.8 | 283,685 | 293,950 |
| 1961 | 780,037 | 202,402 | 35.04 | 387,058 | 392,979 |
| 1971 | 1,072,753 | 292,716 | 37.53 | 541,675 | 531,078 |
| 1981 | 1,420,953 | 348,200 | 32.46 | 721,006 | 699,947 |
| 1991 | 1,837,149 | 416,196 | 29.29 | 938,359 | 898,790 |
| 2001 ++ | 2,293,896 | 456,747 | 24.86 | 1,161,952 | 1,131,944 |
| 2011 | 2,855,794 | 561898 | 24.5 | 1,438,586 | 1,417,208 |
Population Pyramid
Manipur Population by Religion
Hinduism and Chritianity is the major religions with 41% each, followed by Muslims who are called Pangals in Manipur region represent 8%.
| Religion | Persons | Percentage | Males | Females |
|---|---|---|---|---|
| Hindu | 1,181,876 | 41.39 | 596,220 | 585,656 |
| Muslim | 239,836 | 8.40 | 120,404 | 119,432 |
| Christian | 1,179,043 | 41.29 | 595,478 | 583,565 |
| Sikh | 1,527 | 0.05 | 964 | 563 |
| Buddhist | 7,084 | 0.25 | 3,654 | 3,430 |
| Jain | 1,692 | 0.06 | 862 | 830 |
| Others | 233,767 | 8.19 | 115,715 | 118,052 |
| Not Stated | 10,969 | 0.38 | 5,289 | 5,680 |
Ethnic groups of Manipur
According to e-pao, As per the Manipur ethnic grouping, The Manipur people are grouped into three communities, Meiteis, Nagas and Kuki or Chins. Meiteis groups are those living in the valleyes with 29 major tribes.
The Naga group consists of Zeliangrong which consists of Rongmei/Kabui, and Liangmei and Zemei/Kacha Nagas, Tangkhul with 183,091, Mao with 224,361, Maram with 32,098, Maring with 25,657 and Tarao. Anal with 26,508, Kom with 14,621, Thangal.
The Chin-Kuki group consists of Gangte with 15,274, Hmar with 49,081, Paite with 55,031, Thadou with 223,779, Vaiphei with 39,902, Zou with 25,861, Aimol, Chiru, Koireng, Kom with 14,621, Anal with 26,508, Chothe, Lamgang, Koirao, Thangal, Moyon and Monsang. In the Chin state of Myanmar the the 'Chins' are popular, they are called 'Kukis' in the Indian side.
Other tribal groups like Paite with 55,031, Zou with 25,861, Gangte with 15,274, and Vaiphei with 39,902 identify themselves as Zomi Group.
Thadous with 223,779 people remain the major Kuki population in this Chin-Kuki group while Hmar with 49,081 identify closer to the Mizo or Lushei group.
The tribes of Manipur and their population as per census 2011 are:
| Tribes | Population as per Census 2011 |
|---|---|
| All Scheduled Tribes | 1,167,422 |
| Aimol | 3,190 |
| Anal | 23,509 |
| Angami | 95 |
| Chiru | 8,599 |
| Chothe | 3,585 |
| Gangte | 17,178 |
| Hmar | 48,375 |
| Kabui | 103,908 |
| Kacha Naga | 66,158 |
| Koirao | 4,475 |
| Koireng | 1,873 |
| Kom | 14,528 |
| Lamgang | 7,770 |
| Mao | 93,343 |
| Maram | 27,524 |
| Maring | 26,424 |
| Any Mizo (Lushai) tribes | 8,064 |
| Monsang | 2,427 |
| Moyon | 2,516 |
| Paite | 55,542 |
| Purum | 278 |
| Ralte | 17 |
| Sema | 40 |
| Simte | 6,728 |
| Suhte | 804 |
| Tangkhul | 178,568 |
| Thadou | 215,913 |
| Vaiphei | 42,957 |
| Zou | 24,294 |
| Poumai Naga | 127,381 |
| Tarao | 1,066 |
| Kharam | 1,145 |
| Any Kuki tribes | 28,342 |
| Generic Tribes etc. | 20,806 |
Languages spoken in Manipur
English is the official language of Manipur. Although many of the Manipurians speak a Tibeto-Burman language, they differ culturally from the surrounding hill tribes by following Hindu customs. More than 60% of its inhabitants are Meiteis including Bamons and Pangans who settled mostly in the valley, Each group has its own language, tradition and culture. Manipuri or popularly called Meitei is the popular language in Manipur with 54% of the speakers, followed by Mao with 224,361, Thado with 223,779, Tangkhul with 183,091, Kabui 109,616 speakers.
| Languages | Persons | Percentage | Rural | Urban |
|---|---|---|---|---|
| Manipuri | 1,522,132 | 53.2998 | 833,666 | 688,466 |
| Mao | 224,361 | 7.8563 | 223,575 | 786 |
| Thado | 223,779 | 7.8360 | 208,044 | 15,735 |
| Tangkhul | 183,091 | 6.4112 | 153,333 | 29,758 |
| Kabui | 109,616 | 3.8384 | 79,426 | 30,190 |
| Nepali | 63,756 | 2.2325 | 57,201 | 6,555 |
| Paite | 55,031 | 1.9270 | 50,354 | 4,677 |
| Hmar | 49,081 | 1.7186 | 41,011 | 8,070 |
| Liangmei | 45,546 | 1.5949 | 43,312 | 2,234 |
| Vaiphei | 39,902 | 1.3972 | 36,751 | 3,151 |
| Kuki | 37,805 | 1.3238 | 32,424 | 5,381 |
| Maram | 32,098 | 1.1240 | 32,029 | 69 |
| Hindi | 31,703 | 1.1101 | 15,201 | 16,502 |
| Bengali | 30,611 | 1.0719 | 25,140 | 5,471 |
| Anal | 26,508 | 0.9282 | 25,963 | 545 |
| Zou | 25,861 | 0.9056 | 23,620 | 2,241 |
| Maring | 25,657 | 0.8984 | 25,239 | 418 |
| Zemi | 18,795 | 0.6581 | 17,686 | 1,109 |
| Gangte | 15,274 | 0.5348 | 13,953 | 1,321 |
| Kom | 14,621 | 0.5120 | 13,664 | 957 |
| Yimchungre | 8,497 | 0.2975 | 8,188 | 309 |
| Khezha | 6,977 | 0.2443 | 6,965 | 12 |
| Mizo | 6,500 | 0.2276 | 4,797 | 1,703 |
| Zeliang | 2,727 | 0.0955 | 2,724 | 3 |
| AO | 2,529 | 0.0886 | 2,463 | 66 |
| Assamese | 2,453 | 0.0859 | 1,627 | 826 |
Disability
Below is the table of Manipur disable people stats.
| Type of disability | Total Persons | Cultivators | Agriculture labor | HHI | Other workers |
|---|---|---|---|---|---|
| Total disabled population | 25,582 | 11,607 | 2,091 | 2,007 | 9,877 |
| In Seeing | 9,221 | 4,096 | 768 | 760 | 3,597 |
| In Hearing | 6,520 | 3,221 | 462 | 462 | 2,375 |
| In Speech | 1,134 | 469 | 92 | 97 | 476 |
| In Movement | 1,829 | 739 | 170 | 129 | 791 |
| Mental Retardation | 1,554 | 749 | 163 | 113 | 529 |
| Mental Illness | 400 | 184 | 47 | 29 | 140 |
| Any Other | 3,974 | 1,675 | 299 | 351 | 1,649 |
| Multiple disability | 950 | 474 | 90 | 66 | 320 |
Manipur Population projection
Manipur population in 2023 is estimated to be 3.23 million, population in 2022 is estimated to be 3.2 million (32 Lakhs), population in 2021 is estimated to be 3.1 Million (31 Lakhs), According to UID, population in 2020 is estimated to be 3 Million (30 Lakhs).
District wise population in Manipur
Below is the Manipur district wise population as per Census 2011 and 2020 projection. The Manipur state has five hill districts and four valley districts which has a total area of 22,327 sq km. The tribal population are sectioned broadly under two ethnic groups: the Nagas of 18 tribes and the Kuki-Chin-Zomi of 17 tribes. The Nagas are a little more than half of the tribal population, followed by the Kukis, Mizos and other smaller tribes. While the presence of Nagas is highest in Ukhrul district with 93%, other tribals living in this district are Tangkhuls and Tamenglong district with 78% of Nagas and other are kabuls tribals, they are a little over half in Senapati district with 55%, mostly Mao tribe are concentrated in the district of Senapati, and in Chandel district it is 47% along with Anals and Marings. The Kuki-Chin-Zomi tribes and Thadous are the majority in Churachandpur district.
| District | Population(2020 est.) | Population(2011) | Percentage |
|---|---|---|---|
| Senapati | 546,229 | 479,148 | 16.78 |
| Tamenglong | 160,342 | 140,651 | 4.93 |
| Churachandpur | 312,523 | 274,143 | 9.60 |
| Bishnupur | 270,635 | 237,399 | 8.31 |
| Thoubal | 481,272 | 422,168 | 14.78 |
| Imphal West | 590,511 | 517,992 | 18.14 |
| Imphal East | 519,969 | 456,113 | 15.97 |
| Ukhrul | 209,758 | 183,998 | 6.44 |
| Chandel | 164,367 | 144,182 | 5.05 |
 India Population


