Tripura Population 2025
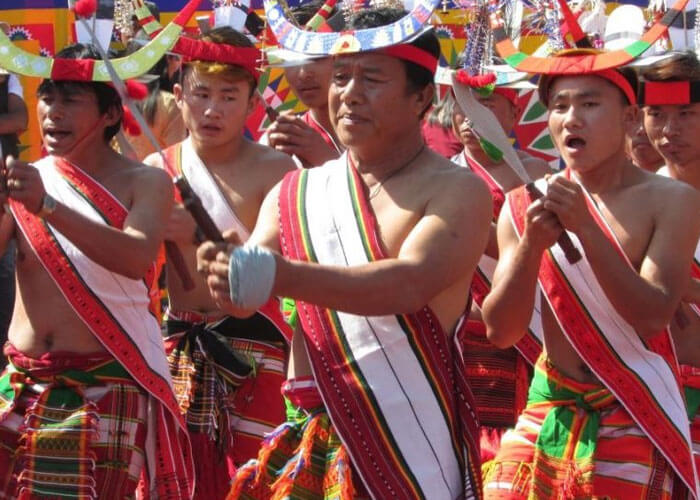
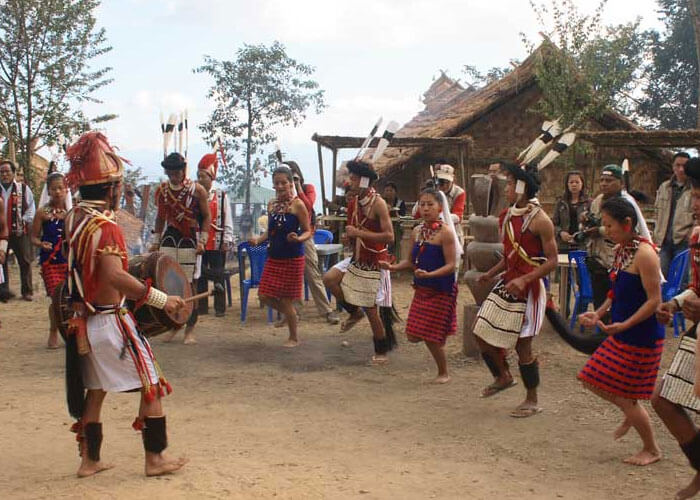
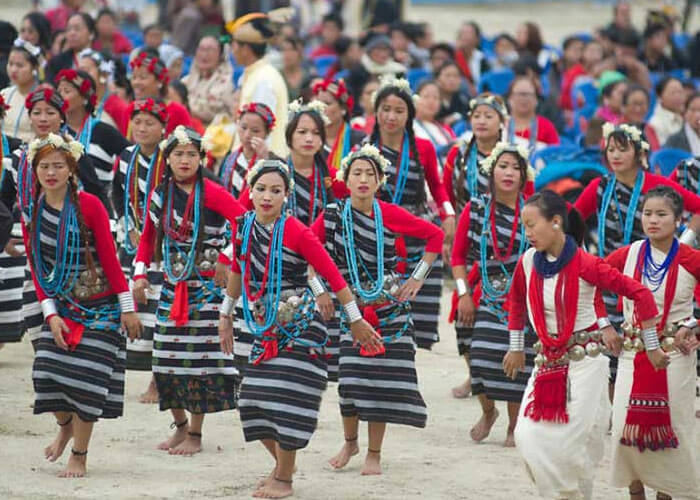
Tripura is the north-eastern state in India, borders 3 sides by Bangladesh to the west, north, south, and Mizoram and Assam on the eastern side. Geographically it is hill ranges, valleys and plains, total area is 10,491 sq km. and is third smallest state, and area rank is 26th in India behind Goa and Sikkim, forests cover more than half of the area. Tripura population in 2025 is estimated to be 4.16 million (41.6 Lakhs), By Aug 2023, Tripura population is projected to be 41.47 Lakhs as per Unique Identification Aadhar India, updated 31, May 2023. As per NFHS 2019-2021 report, Total Fertility Rate of Tripura State is 1.7 children per women compared to 1.7 in 2016. Tripura being gifted with lush green landscape, and its ethnic and cultural diversity of the population. It's home to the indigenous tribals, As per 2011 census the indigenous tribals of Tripura comprising a total of 19 communities, which constitute of 31% of the state's population while 69.95% are non-tribals mostly Bengalis. Regarding the tribal population in Tripura, Some of the tribals originally moved from neighbouring hill regions. The Tripuri constitute more than half the tribal community. Other prominent tribal groups include the Chakma, Halam, Reang, Garo, Lusai,Marma, Bhils, Santhals, Mundas and Oraons.
| Census year | Persons | Absolute | Percentage | Males | Females |
|---|---|---|---|---|---|
| 1901 | 173,325 | - | - | 92,495 | 80,830 |
| 1911 | 229,613 | 56,288 | 32.48 | 121,820 | 107,793 |
| 1921 | 304,437 | 74,824 | 32.59 | 161,515 | 142,922 |
| 1931 | 382,450 | 78,013 | 25.63 | 202,932 | 179,518 |
| 1941 | 513,010 | 130,560 | 34.14 | 272,025 | 240,985 |
| 1951 | 639,029 | 126,019 | 24.56 | 335,589 | 303,440 |
| 1961 | 1,142,005 | 502,976 | 78.71 | 591,237 | 550,768 |
| 1971 | 1,556,342 | 414,337 | 36.28 | 801,126 | 755,216 |
| 1981 | 2,053,058 | 496,716 | 31.92 | 1,054,846 | 998,212 |
| 1991 | 2,757,205 | 704,147 | 34.3 | 1,417,930 | 1,339,275 |
| 2001 | 3,199,203 | 441,998 | 16.03 | 1,642,225 | 1,556,978 |
| 2011 | 3,673,917 | 474,714 | 14.84 | 1,874,376 | 1,799,541 |
Population Pyramid
Tripura Population by Religion
Tripura population religion wise, While Hinduism continues to be the religious faith of majority population wiht 83%, followed by Muslim population with 8%, Christian with 4.3% and Buddhist with 3.4%. Chakma and Mogh's are Buddhist most originally moved to Tripura from various hill regions in neighbouring districts like Chittagong district.
| Religion | Persons | Percentage | Males | Females |
|---|---|---|---|---|
| Hindu | 3,063,903 | 83.40 | 1,563,730 | 1,500,173 |
| Muslim | 316,042 | 8.60 | 160,930 | 155,112 |
| Christian | 159,882 | 4.35 | 81,480 | 78,402 |
| Sikh | 1,070 | 0.03 | 782 | 288 |
| Buddhist | 125,385 | 3.41 | 63,545 | 61,840 |
| Jain | 860 | 0.02 | 453 | 407 |
| Others | 1,514 | 0.04 | 791 | 723 |
| Not Stated | 5,261 | 0.14 | 2,665 | 2,596 |
Ethnic groups of Tripura
Different tribes of Tripura are Tripuri, Bhil, Bhutias, Chakma, Chaimal, Garo, Halam, Jamatia, Khasihia, Kuki, Lepcha, Lushai, Mog, Munda, Noatia, Orang, Reang, Santal, Uchui.
Major 16 sub-clans of Halams are Kaloi, Kor-Bong, Keipeng, Bong, Saka Chep, Thanga chep, Dab, Bongser, Rupini, Hrangkhawl, Chorai, Langai, Kaireng, Ranglong, Naveen and Khulang.
the tribes of Tripura and their population as per census 2011 are:
| Tribes | Population as per Census 2011 |
|---|---|
| All Scheduled Tribes | 1,166,813 |
| Bhil | 3,105 |
| Bhutia | 28 |
| Chaimal | 549 |
| Chakma | 79,813 |
| Garoo | 12,952 |
| Halam, Bengshel, Dub, Kaipeng, Kalai, Karbong, Lengui, Mussum, Rupini, Sukuchep, Thangchep | 57,210 |
| Jamatia | 83,347 |
| Khasia | 366 |
| Kuki, including the following sub-tribes: | 10,965 |
| Lepcha | 157 |
| Lushai | 5,384 |
| Mag | 37,893 |
| Munda, Kaur | 14,544 |
| Noatia, Murashing | 14,298 |
| Orang | 12,011 |
| Riang | 188,220 |
| Santal | 2,913 |
| Tripura, Tripuri, Tippera | 592,255 |
| Uchai | 2,447 |
| Generic Tribes etc. | 48,356 |
Languages spoken in Tripura
Language wise population, The main Tripura language is Tripuri, spoken by tribals, used to be most widely spoken language before Independence as the migrants and some tribals moved from the neighbouring hill stations. Today as on census 2011, Bengali is the widely spoken language in Tripura state, followed by Tripuri with 25.8%, Hindi with 2.1%. Mogh is spoken by 35,722 people, Halam with 23,089, Kurukh/Oraon with 7,145, Mizo with 5,639, Santali with 3,975 and Savara with 4,620, Munda with 9,644. Manipuri with 23,779, Bishnupuriya with 22,112, Odia with 25,967, Assamese with 2,129 and Telugu with 2,787 speakers.
| Languages | Persons | Percentage | Rural | Urban |
|---|---|---|---|---|
| Bengali | 2,414,774 | 65.7275 | 1,532,133 | 882,641 |
| Tripuri | 950,875 | 25.8818 | 915,423 | 35,452 |
| Hindi | 77,701 | 2.1149 | 56,503 | 21,198 |
| Mogh | 35,722 | 0.9723 | 34,895 | 827 |
| Odia | 25,967 | 0.7068 | 23,911 | 2,056 |
| Manipuri | 23,779 | 0.6472 | 16,894 | 6,885 |
| Halam | 23,089 | 0.6285 | 21,778 | 1,311 |
| Bishnupuriya | 22,112 | 0.6019 | 20,400 | 1,712 |
| AO | 19,316 | 0.5258 | 19,235 | 81 |
| Munda | 9,644 | 0.2625 | 9,570 | 74 |
| Kurukh/Oraon | 7,145 | 0.1945 | 6,785 | 360 |
| Mizo | 5,639 | 0.1535 | 5,389 | 250 |
| Savara | 4,620 | 0.1258 | 4,272 | 348 |
| Santali | 3,975 | 0.1082 | 3,864 | 111 |
| Telugu | 3,845 | 0.1047 | 3,398 | 447 |
| Nepali | 2,787 | 0.0759 | 961 | 1,826 |
| Assamese | 2,129 | 0.0579 | 1,041 | 1,088 |
Disability
Below table is the disable population of Tripura state.
| Type of disability | Total Persons | Cultivators | Agriculture labor | HHI | Other workers |
|---|---|---|---|---|---|
| Total disabled population | 21,627 | 3,905 | 4,637 | 690 | 12,395 |
| In Seeing | 3,853 | 715 | 796 | 125 | 2,217 |
| In Hearing | 5,407 | 1,046 | 1,186 | 162 | 3,013 |
| In Speech | 1,471 | 271 | 338 | 43 | 819 |
| In Movement | 3,772 | 553 | 688 | 107 | 2,424 |
| Mental Retardation | 985 | 210 | 273 | 29 | 473 |
| Mental Illness | 553 | 90 | 134 | 18 | 311 |
| Any Other | 4,622 | 855 | 1,011 | 175 | 2,581 |
| Multiple disability | 964 | 165 | 211 | 31 | 557 |
Tripura Population projection
Tripura population in 2023 is estimated to be 4.15 million, population in 2022 is estimated to be 4.11 million (41.1 Lakhs), population in 2021 is estimated to be 4.07 million (40.7 Lakhs), According to UID, population in 2020 is estimated to be 4 million (41 Lakhs).
District wise population in Tripura
As on 2012, For administrative purposes, the state has been divided into 8 districts which includes 4 new districts Sipahijala, Khowai, Gomati and Unakoti. Below is the Tripura district wise population as per Census 2011 and 2020 projection.
| District | Population(2020 est.) | Population(2011) | Percentage |
|---|---|---|---|
| West Tripura | 1,045,989 | 917,534 | 24.97 |
| South Tripura | 494,460 | 433,737 | 11.81 |
| Dhalai | 430,906 | 377,988 | 10.29 |
| North Tripura | 474,178 | 415,946 | 11.32 |
| Unakoti | 316,162 | 277,335 | 7.55 |
| Khowai | 373,226 | 327,391 | 8.91 |
| Sipahijala | 552,026 | 484,233 | 13.18 |
| Gomati | 498,030 | 436,868 | 11.89 |
 India Population


