Karnataka Population 2026
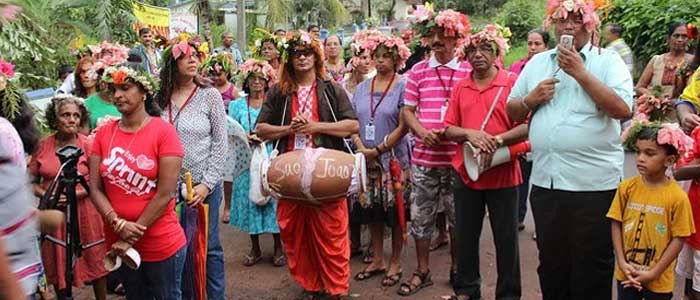
Image Source: Kannada people of Raichur district gathering for liquor ban, 2016
| Census year | Persons | Absolute | Percentage | Males | Females |
|---|---|---|---|---|---|
| 1901 | 13,054,754 | - | - | 6,582,105 | 6,472,649 |
| 1911 | 13,525,251 | 470,497 | 3.6 | 6,827,801 | 6,697,450 |
| 1921 | 13,377,599 | -147,652 | -1.09 | 6,793,718 | 6,583,881 |
| 1931 | 14,632,992 | 1,255,393 | 9.38 | 7,445,458 | 7,187,534 |
| 1941 | 16,255,368 | 1,622,376 | 11.09 | 8,294,043 | 7,961,325 |
| 1951 | 19,401,956 | 3,146,588 | 19.36 | 9,866,923 | 9,535,033 |
| 1961 | 23,586,772 | 4,184,816 | 21.57 | 12,040,923 | 11,545,849 |
| 1971 | 29,299,014 | 5,712,242 | 24.22 | 14,971,900 | 14,327,114 |
| 1981 | 37,135,714 | 7,836,700 | 26.75 | 18,922,627 | 18,213,087 |
| 1991 | 44,977,201 | 7,841,487 | 21.12 | 22,951,917 | 22,025,284 |
| 2001 | 52,850,562 | 7,873,361 | 17.51 | 26,898,918 | 25,951,644 |
| 2011 | 61,095,297 | 8,244,735 | 15.6 | 30,966,657 | 30,128,640 |
Population Pyramid
Karnataka Population by Religion
The diverse linguistic and religious ethnicity that are native to Karnataka State, combined with their long histories, have contributed significantly to the cultural heritage of the state. As on last census, Karnataka population religion wise are 51 million(84.00%) of the population were Hindu, 7.8 million, about 12.92% were Muslim, 1.1 million (1.87%) were Christian, 0.72% were Jains around 440,280, 95,710(0.16%) were Buddhist, 28,773(0.05%) were Sikh and 0.02% were belonging to other religions.0.27 % of the population did not state their religion. The total muslim population is 7.8 million after the largest Hindu population with 51.3 million, Christians 1.1 Million and Jains with 66834193.
| Religion | Persons | Percentage | Males | Females |
|---|---|---|---|---|
| Hindu | 51,317,472 | 84.00 | 26,017,983 | 25,299,489 |
| Muslim | 7,893,065 | 12.92 | 4,007,871 | 3,885,194 |
| Christian | 1,142,647 | 1.87 | 557,436 | 585,211 |
| Sikh | 28,773 | 0.05 | 15,955 | 12,818 |
| Buddhist | 95,710 | 0.16 | 55,015 | 40,695 |
| Jain | 440,280 | 0.72 | 225,544 | 214,736 |
| Others | 11,263 | 0.02 | 5,704 | 5,559 |
| Not Stated | 166,087 | 0.27 | 81,149 | 84,938 |
Ethnic groups of Karnataka
| Tribes | Population as per Census 2011 |
|---|---|
| All Scheduled Tribes | 4,248,987 |
| Adiyan | 758 |
| Barda | 266 |
| Bavacha, Bamcha | 960 |
| Bhil, Bhil Garasia, Dholi Bhil, Dungri Bhil, Dungri Garasia, Mewasi Bhil, Rawal Bhil, Tadvi Bhil, Bhagalia, Bhilala, Pawra, Vasava, Vasave | 6,204 |
| Chenchu, Chenchwar | 954 |
| Chodhara | 117 |
| Dubla, Talavia, Halpati | 264 |
| Gamit, Gamta, Gavit, Mavchi, Padvi, Valvi | 516 |
| Gond, Naikpod, Rajgond | 158,243 |
| Gowdalu | 8,617 |
| Hakkipikki | 11,892 |
| Hasalaru | 24,466 |
| Irular | 703 |
| Iruliga | 10,259 |
| Jenu Kuruba | 36,076 |
| Kadu Kuruba | 11,953 |
| Kammara (in South Kanara disitrict and Kollegal taluk of Mysore district)c | 949 |
| Kaniyan, Kanyan (in Kollegal taluk of Mysore district)d | 413 |
| Kathodi, Katkari, Dhor Kathodi, Dhor Katkari, Son Kathodi, Son Katkari | 274 |
| Kattunayakan | 168 |
| Kokna, Kokni, Kukna | 32 |
| Koli Dhor, Tokre Koli, Kolcha, Kolgha | 112,190 |
| Konda Kapus | 7,438 |
| Koraga | 14,794 |
| Kota | 121 |
| Koya, Bhine Koya, Rajkoya | 365 |
| Kudiya, Melakudi | 2,169 |
| Kuruba (in Coorg district)a | 3,111 |
| Kurumans | 347 |
| Maha Malasar | 36 |
| Malaikudi | 9,236 |
| Malasar | 82 |
| Malayekandi | 116 |
| Maleru | 440 |
| Maratha (in Coorg district)a | 3,396 |
| Marati (in South Kanara district)e | 82,447 |
| Meda, Medari, Gauriga, Burud | 44,160 |
| Naikda, Nayaka, Cholivala Nayaka, Kapadia Nayaka, Mota Nayaka, Nana Nayaka, Naik, Nayak, Beda, Bedar and Valmiki | 3,296,354 |
| Palliyan | 226 |
| Paniyan | 495 |
| Pardhi, Advichincher, Phanse Pardhi, Haranshikari | 10,746 |
| Patelia | 57 |
| Rathawa | 45 |
| Sholaga | 52 |
| Soligaru | 33,819 |
| Toda | 147 |
| Varli | 58 |
| Vitolia, Kotwalia, Barodia | 23 |
| Yerava | 30,359 |
| Siddi (in Uttar Kannada district) | 10,477 |
| Generic Tribes etc. | 311,597 |
Literacy rate in Karnataka
The Karnataka State Literacy is 75.60% and sex ratio is 973 per 1000 males. As per the 2011 census, Karnataka had a literacy rate of 75.60%, with 82.85% of males and 68.13% of females in the state being literate. In 2001 the literacy rate of the state were 67.04%, with 76.29% of males and 57.45% of females being literate. Literacy rate increased to 9% more at 2011 census from 66.64 percent in 2001 to 75.60 percent. Urban male literacy rate has crossed 90%.
Languages spoken in Karnataka
Kannada is the most widely spoken in the state and official language and spoken as a native language by about 66.53%, Kannada Population is 44.6 million in Karnataka compared to 66.26% of the people as of 2001. Other linguistic minorities in the state were Urdu 10.83%(6.6 million) compared to 10.54%, 3.5 million Telugu 5.84 compared 7.03% in 2001, Tamil (3.4% in 2011 vs 3.57% in 2001, Marathi with 3.3%, Tulu with 2.6%), Hindi (2.56%), Konkani (1.29%), Malayalam (1.26%).
| Languages | Persons | Percentage | Rural | Urban |
|---|---|---|---|---|
| Kannada | 40,651,090 | 66.5372 | 29,040,962 | 11,610,128 |
| Urdu | 6,618,324 | 10.8328 | 2,142,104 | 4,476,220 |
| Telugu | 3,569,400 | 5.8423 | 1,617,894 | 1,951,506 |
| Tamil | 2,110,128 | 3.4538 | 332,578 | 1,777,550 |
| Marathi | 2,064,906 | 3.3798 | 1,237,722 | 827,184 |
| Hindi | 2,013,364 | 3.2954 | 1,088,225 | 925,139 |
| Tulu | 1,595,038 | 2.6107 | 989,173 | 605,865 |
| Konkani | 788,294 | 1.2903 | 357,372 | 430,922 |
| Malayalam | 774,057 | 1.2670 | 339,952 | 434,105 |
| Gujarati | 114,616 | 0.1876 | 11,083 | 103,533 |
| Coorgi/Kodagu | 110,508 | 0.1809 | 76,421 | 34,087 |
| Bengali | 87,963 | 0.1440 | 21,595 | 66,368 |
| Odia | 64,119 | 0.1049 | 16,212 | 47,907 |
| Tibetan | 27,544 | 0.0451 | 24,314 | 3,230 |
| Punjabi | 25,981 | 0.0425 | 1,085 | 24,896 |
| Nepali | 19,274 | 0.0315 | 3,940 | 15,334 |
| Sindhi | 16,954 | 0.0278 | 86 | 16,868 |
| Assamese | 9,871 | 0.0162 | 2,984 | 6,887 |
| Manipuri | 4,103 | 0.0067 | 303 | 3,800 |
| Kashmiri | 3,388 | 0.0055 | 833 | 2,555 |
| Bhili | 2,621 | 0.0043 | 1,667 | 954 |
Disability
| Type of disability | Total Persons | Cultivators | Agriculture labor | HHI | Other workers |
|---|---|---|---|---|---|
| Total disabled population | 503,902 | 102,038 | 122,778 | 19,029 | 260,057 |
| In Seeing | 103,751 | 19,333 | 22,978 | 3,273 | 58,167 |
| In Hearing | 106,291 | 20,595 | 23,772 | 4,152 | 57,772 |
| In Speech | 35,736 | 8,794 | 11,027 | 1,270 | 14,645 |
| In Movement | 104,941 | 23,208 | 25,825 | 3,830 | 52,078 |
| Mental Retardation | 19,464 | 4,055 | 5,653 | 660 | 9,096 |
| Mental Illness | 4,302 | 923 | 1,373 | 182 | 1,824 |
| Any Other | 110,967 | 20,888 | 26,845 | 4,936 | 58,298 |
| Multiple disability | 18,450 | 4,242 | 5,305 | 726 | 8,177 |
Karnataka Population projection
According to UID, Karnataka population in 2022 is estimated to be 67.3 million (6.73 Crores), in 2021 is projected to be 68.4 Million (6.84 Crores), population in 2020 is estimated to be 67 million (6.7 Crores) and population in 2023 is estimated to be 67.71 Million.
Income Distribution
Karnataka is the third largest state economy in India, one of the industrialized states in the country and is leading in driving India's economic growth. Economic growth and fast development of any state depends on Industrial policy. Agriculture is the major sector depended by rural population. The major crops in Karnataka state are Ragi, Jowar, Sugarcane, Rice, Coconut, Groundnuts, Coffee and Cotton. Karnataka stands at top among the states of the country in terms of manufacturing categories are Electronics, Computer, Garments, Aeronautics, Machine Tools, Electrical Engineering, Aluminium and Steel. Karnataka economic model is most progressive with just 5% of the country's population, the state contributes to 6% of GDP. Karnataka is leading IT industry in the country which was developed from 1995. Bengaluru is one of the largest technology cluster in the world after Silicon Valley.
District wise population in Karnataka
Karnataka district wise population as per Census 2011 and 2020 projection as per below table data. Karnataka State has 30 districts and 4 administrative divisions. Bijapur is the biggest district in the State with an area of 17,069 Sq km covering 8.90% of the area of the State. Kodagu is the smallest district in the State with an area of 4102 Sq Km covering 2.14% of the total area of the State.
| District | Population(2020 est.) | Population(2011) | Percentage |
|---|---|---|---|
| Belgaum | 5,448,814 | 4,779,661 | 7.82 |
| Bagalkot | 2,154,317 | 1,889,752 | 3.09 |
| Bijapur | 2,482,157 | 2,177,331 | 3.56 |
| Bidar | 1,941,762 | 1,703,300 | 2.79 |
| Raichur | 2,198,846 | 1,928,812 | 3.16 |
| Koppal | 1,584,509 | 1,389,920 | 2.28 |
| Gadag | 1,213,610 | 1,064,570 | 1.74 |
| Dharwad | 2,105,606 | 1,847,023 | 3.02 |
| Uttara Kannada | 1,638,373 | 1,437,169 | 2.35 |
| Haveri | 1,821,342 | 1,597,668 | 2.62 |
| Bellary | 2,795,958 | 2,452,595 | 4.01 |
| Chitradurga | 1,891,780 | 1,659,456 | 2.72 |
| Davanagere | 2,217,867 | 1,945,497 | 3.18 |
| Shimoga | 1,998,138 | 1,752,753 | 2.87 |
| Udupi | 1,342,192 | 1,177,361 | 1.93 |
| Chikmagalur | 1,297,276 | 1,137,961 | 1.86 |
| Tumkur | 3,054,037 | 2,678,980 | 4.38 |
| Bangalore | 10,968,568 | 9,621,551 | 15.75 |
| Mandya | 2,058,577 | 1,805,769 | 2.96 |
| Hassan | 2,025,120 | 1,776,421 | 2.91 |
| Dakshina Kannada | 2,382,200 | 2,089,649 | 3.42 |
| Kodagu | 632,152 | 554,519 | 0.91 |
| Mysore | 3,421,285 | 3,001,127 | 4.91 |
| Chamarajanagar | 1,163,702 | 1,020,791 | 1.67 |
| Gulbarga | 2,925,612 | 2,566,326 | 4.20 |
| Yadgir | 1,338,669 | 1,174,271 | 1.92 |
| Kolar | 1,751,497 | 1,536,401 | 2.51 |
| Chikkaballapura | 1,430,819 | 1,255,104 | 2.05 |
| Bangalore Rural | 1,129,652 | 990,923 | 1.62 |
| Ramanagara | 1,234,205 | 1,082,636 | 1.77 |