Tamil Nadu Population 2025


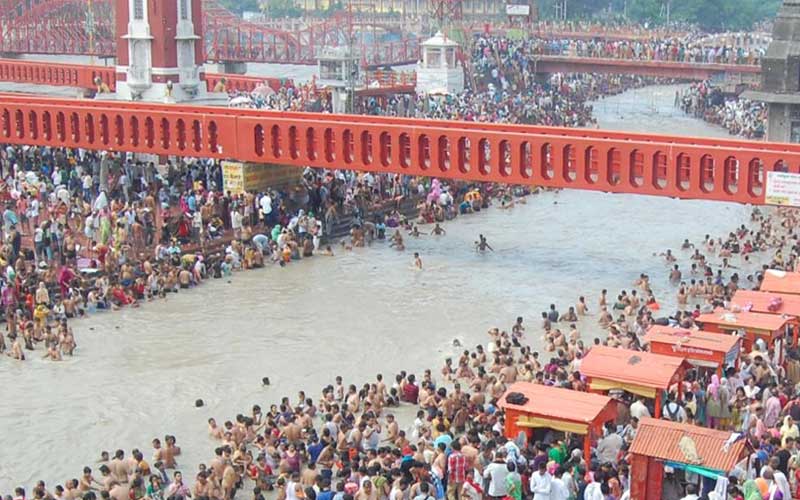
Source Image: Tamilians Celebrating of Karthigai Deepam festival
As per Census 2011, the total population of Tamil Nadu is 72.14 million. Of this, the rural population is 37.2 million and the urban population is 34.9 million. Villupuram district has the largest rural population of 2.9 million (7.9% of the State's rural population) whereas Chennai has the highest urban population of 4.6 million (13.3% of State's urban population).
| Census year | Persons | Absolute | Percentage | Males | Females |
|---|---|---|---|---|---|
| 1901 | 19,252,630 | - | - | 9,419,398 | 9,833,232 |
| 1911 | 20,902,616 | 1,649,986 | 8.57 | 10,236,951 | 10,665,665 |
| 1921 | 21,628,518 | 725,902 | 3.47 | 10,659,489 | 10,969,029 |
| 1931 | 23,472,099 | 1,843,581 | 8.52 | 11,577,988 | 11,894,111 |
| 1941 | 26,267,507 | 2,795,408 | 11.91 | 13,056,967 | 13,210,540 |
| 1951 | 30,119,047 | 3,851,540 | 14.66 | 15,003,724 | 15,115,323 |
| 1961 | 33,686,953 | 3,567,906 | 11.85 | 16,910,978 | 16,775,975 |
| 1971 | 41,199,168 | 7,512,215 | 22.3 | 20,828,021 | 20,371,147 |
| 1981 | 48,408,077 | 7,208,909 | 17.5 | 24,487,624 | 23,920,453 |
| 1991 | 55,858,946 | 7,450,869 | 15.39 | 28,298,975 | 27,559,971 |
| 2001 | 62,405,679 | 6,546,733 | 11.72 | 31,400,909 | 31,004,770 |
| 2011 | 72,147,030 | 9,741,351 | 15.61 | 36,137,975 | 36,009,055 |
Population Pyramid
Tamil Nadu Population by Religion
As per 2011 Census Tamil nadu population religion wise, Hinduism is the largest religion with 63 million - 87.5%, followed by Muslim with 5.8%, Christianity with 6%. All other religions like Jains and Buddhists represent less than 1%. The total muslim population 4.2 million is the third largest after Christians with 4.4 million people. Jallikattu very similar to bullfighting in Spain, is a Hindu traditional event and inseparable part of Tamil culture and tradition. This sport of taming the bull has been organised and played for ages, and every year locals participate in bullfighting with fierce enthusiasm. It is believed that the Jallikattu started playing from 400 BC, is a sport that has been practised in southern India for thousands of years. The sport began during the Tamil festival Pongal, is generally celebrated in the second week of January. Pongal is one of the most popular festivals in South India, is a harvest festival that is celebrated in Tamil Nadu, Andhra Pradesh, Telangana and Karnataka.
| Religion | Persons | Percentage | Males | Females |
|---|---|---|---|---|
| Hindu | 63,188,168 | 87.58 | 31,715,046 | 31,473,122 |
| Muslim | 4,229,479 | 5.86 | 2,099,182 | 2,130,297 |
| Christian | 4,418,331 | 6.12 | 2,171,413 | 2,246,918 |
| Sikh | 14,601 | 0.02 | 8,088 | 6,513 |
| Buddhist | 11,186 | 0.02 | 5,976 | 5,210 |
| Jain | 89,265 | 0.12 | 45,605 | 43,660 |
| Others | 7,414 | 0.01 | 3,781 | 3,633 |
| Not Stated | 188,586 | 0.26 | 88,884 | 99,702 |
Ethnic groups of Tamil Nadu
The Tamil Nadu state tribes and their population as per census 2011 are
| Tribes | Population as per Census 2011 |
|---|---|
| All Scheduled Tribes | 794,697 |
| Adiyan | 4,426 |
| Aranadan | 138 |
| Eravallan | 2,871 |
| Irular | 189,661 |
| Kadar | 650 |
| Kammara (excluding Kanyakumari district and Shenkottah taluk of Tirunelveli district) | 1,052 |
| Kanikaran, Kanikkar (in Kanyakumari district and Shenkottah and Ambasamudram taluks of Tirunelveli district) | 3,837 |
| Kaniyan, Kanyan | 2,137 |
| Kattunayakan | 46,672 |
| Kochu Velan | 7 |
| Konda Kapus | 521 |
| Kondareddis | 9,847 |
| Koraga | 101 |
| Kota (excluding Kanyakumari district and Shenkottah taluk of Tirunelveli district) | 308 |
| Kudiya, Melakudi | 66 |
| Kurichchan | 6,100 |
| Kurumbas (in the Nilgiris district) | 6,823 |
| Kurumans | 30,965 |
| Maha Malasar | 77 |
| Malai Arayan | 172 |
| Malai Pandaram | 1,439 |
| Malai Vedan | 7,215 |
| Malakkuravan | 19,645 |
| Malasar | 6,431 |
| Malayali (in Dharmapuri, North Arcot, Pudukottai, Salem, South Arcot and Tiruchirapalli districts) | 357,980 |
| Malayekandi | 210 |
| Mannan | 211 |
| Mudugar, Muduvan | 1,250 |
| Muthuvan | 390 |
| Palleyan | 231 |
| Palliyan | 2,252 |
| Palliyar | 5,288 |
| Paniyan | 10,134 |
| Sholaga | 5,965 |
| Toda (excluding Kanyakumari district and Shenkottah taluk of Tirunelveli district) | 2,002 |
| Uraly | 12,986 |
| Generic Tribes etc. | 54,637 |
Literacy rate in Tamil Nadu
The Effective Literacy Rate in Tamil Nadu works out to 80.1 % (Rural: 73.5 %, Urban: 87.0 %). There has been an increase of 6.6 % in the effective literacy rate (7.3% in rural areas and 4.5 % in urban areas) during the last decade.
Languages spoken in Tamil Nadu
The Official languages spoken in the state is Tamil. Other language spoken include Telugu, Malayalam, Hindi,English and other Indian languages being spoken in the state.
| Languages | Persons | Percentage | Rural | Urban |
|---|---|---|---|---|
| Tamil | 63,753,997 | 88.3668 | 34,096,860 | 29,657,137 |
| Telugu | 4,234,302 | 5.8690 | 1,973,884 | 2,260,418 |
| Kannada | 1,286,175 | 1.7827 | 694,645 | 591,530 |
| Urdu | 1,264,537 | 1.7527 | 243,487 | 1,021,050 |
| Malayalam | 726,096 | 1.0064 | 109,184 | 616,912 |
| Hindi | 393,380 | 0.5452 | 48,662 | 344,718 |
| Gujarati | 275,023 | 0.3812 | 17,862 | 257,161 |
| Marathi | 85,454 | 0.1184 | 18,848 | 66,606 |
| Bengali | 22,969 | 0.0318 | 2,515 | 20,454 |
| Odia | 21,381 | 0.0296 | 7,414 | 13,967 |
| Sindhi | 8,448 | 0.0117 | 58 | 8,390 |
| Nepali | 7,575 | 0.0105 | 1,663 | 5,912 |
| Punjabi | 6,565 | 0.0091 | 394 | 6,171 |
| Konkani | 6,098 | 0.0085 | 222 | 5,876 |
| Tulu | 2,636 | 0.0037 | 331 | 2,305 |
| Assamese | 2,594 | 0.0036 | 674 | 1,920 |
Disability
The table below illustrates the disable population of Tamil Nadu state.
| Type of disability | Total Persons | Cultivators | Agriculture labor | HHI | Other workers |
|---|---|---|---|---|---|
| Total disabled population | 442,032 | 49,519 | 124,460 | 21,814 | 246,239 |
| In Seeing | 49,160 | 6,177 | 15,420 | 2,181 | 25,382 |
| In Hearing | 99,858 | 12,448 | 29,837 | 4,798 | 52,775 |
| In Speech | 32,227 | 4,142 | 11,581 | 1,514 | 14,990 |
| In Movement | 119,867 | 11,509 | 27,437 | 6,747 | 74,174 |
| Mental Retardation | 12,189 | 1,658 | 4,115 | 565 | 5,851 |
| Mental Illness | 4,480 | 592 | 1,759 | 226 | 1,903 |
| Any Other | 104,117 | 10,776 | 27,759 | 4,769 | 60,813 |
| Multiple disability | 20,134 | 2,217 | 6,552 | 1,014 | 10,351 |
Tamil Nadu Population projection
According to UID, Tamil Nadu population in 2022 is estimated to be 76.63 Million (7.66 Crores), in 2021 is estimated to be 76.40 Million (7.64 Crores), population in 2020 is estimated to be 77 Million (7.7 Crores), and population in 2023 is estimated to be 76.9 Million.
Income Distribution
Tamilnadu is the largest contributor to India's GDP 8.4% which is second in the Country after Maharastra State. Tamil Nadu is known as a major exporter of Leather and Leather Goods, Textiles and Garments, Automobiles and Components and other engineering goods, pharmaceuticals, spices, agro-products, electronic hardware and software. As per India's industrial output its contribution upto 11%. With the second largest coastline in the country of around 1076 kms, a network of 3 major ports and 23 minor ports that includes India's most efficient container port at Chennai.
Sivakasi district is the leader in the areas of printing, fireworks, and safety matches. It contributes to 90% of safety matches production as well as 90% of India's total fireworks production. Sivakasi provides over 60% of India's total offset printing services.
There are many districts, cities and towns who plays a significant role in the Indian economy by producing textiles and providing direct employment to an estimated 35 million people. The garment units in and around the Districts provide employment opportunity to nearly 1 million people, and thereby textile industry is contributing 4% of GDP and 35% of gross export earnings. In terms of total manufacturing sector, the textile industry contributes to 14%. The cities of Coimbatore, Karur, Erode, Tirupur, Gobichettipalayam, Perundurai and in Tamil Nadu are the largest garment exporters in India and referred to as the textile valley in the southern india. Tamilnadu textile units contribute good share towards generation of foreign exchange through home textile exports such as bed linens, kitchen linens, toilet linens, table linens and wall hangings. Madurai and Kanchipuram is very famous for handloom sarees.
Tamil Nadu has a coastline of about 1,076 kilometres (700 mi) which is the country's second longest coastline. Historically Tamil Nadu is an agricultural state from last 10,000 years, In the 21st century the state in its advances in other fields launched the state into competition with other areas.Tamil Nadu is India's second biggest producer of rice. Agriculture is heavily dependent on the river water and monsoon rains. The perennial rivers are Palar, Ponnaiyar, Kaveri, Cheyyar, Meyar, Bhavani, Amaravati, Vaigai, Chittar and Tamaraparani. Non-perennial rivers include the Vellar, Suruli, Siruvani, Gundar,Noyyal, Vaipar, Valparai and Varshali. This state is leading producer of kambu, groundnut corn, rye, oil seeds and sugarcane. Plantation crops are tea, coffee, cardamom and rubber. Major forest produces are timber, sandalwood, pulp wood and fuel wood. Tamilnadu occupies a premier position in the production and extensive application of bio-fertilizers. The trade and industries in the city has spurred the growth of the financial sector in the city. Over a span of 10 years, the industrial GSDP in the State increased from Rs.45,066 crore in 2004-05 to Rs.90,664 crore in 2013-14.
Chennai is the financial capital of South India. Tamil Nadu is the second largest economy in India with a GSDP of US$150 billion in 2014-15 when it grew at 14.34%. Per capita GDP of Tamil Nadu was $1,622 in the year 2010-11, the sixth highest in India. Tamil Nadu is also the most urbanized, accounting for 9.6% of the urban population while only comprising 6% of India's total population according to the 2011 census.
In tune with varying growth performance, the share of industrial income to overall GSDP increased from 20.58 per cent during 2004-05, then declined to 18.81 per cent during 2008-09 and again increased to 21.19 per cent in during 2013-14.
Services industry is one of the key industries in India for the new age and it contributes to 45% of the economic activity in the state, followed by manufacturing at 34% and agriculture at 21%. Tamil Nadu has a wide network substantial industrial parks and estates offering developed plots with supporting infrastructure. State Government is taking all out efforts for a vibrant and sustained high growth in the industrial sector.
Tamil Nadu is a major exporter of a variety of manufactured goods like automobiles, auto components, Engineering goods, Textiles and Garments, Leather products, Electronic Hardware, Chemicals, etc., apart from Software and Support services. Tamil Nadu's exports stood at a value of Rs.1,80,179 crore during 2012-2013.
District wise population in Tamil Nadu
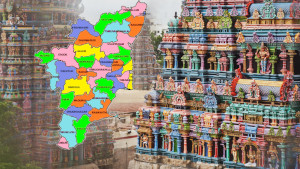
In Tami Nadu there are 32 districts, 215 sub-districts, 1097 towns and 15,979 Villages as per Census 2011. The corresponding figures for 2001 were 30 districts, 201 Sub-districts, 832 Towns and 16,317 Villages. There is an increase of 2 Districts, 14 Sub-districts and 265 Towns (All Census Towns). In respect of villages the number has come down from 16,317 to 15,979. Below table illustrates Tamil Nadu Population in district wise.
| District | Population(2020 est.) | Population(2011) | Percentage |
|---|---|---|---|
| Thiruvallur | 4,250,039 | 3,728,104 | 5.17 |
| Chennai | 5,297,274 | 4,646,732 | 6.44 |
| Kancheepuram | 4,558,007 | 3,998,252 | 5.54 |
| Vellore | 4,487,417 | 3,936,331 | 5.46 |
| Tiruvannamalai | 2,809,958 | 2,464,875 | 3.42 |
| Viluppuram | 3,943,115 | 3,458,873 | 4.79 |
| Salem | 3,969,544 | 3,482,056 | 4.83 |
| Namakkal | 1,968,325 | 1,726,601 | 2.39 |
| Erode | 2,566,988 | 2,251,744 | 3.12 |
| The Nilgiris | 838,349 | 735,394 | 1.02 |
| Dindigul | 2,462,144 | 2,159,775 | 2.99 |
| Karur | 1,213,522 | 1,064,493 | 1.48 |
| Tiruchirappalli | 3,103,411 | 2,722,290 | 3.77 |
| Perambalur | 644,354 | 565,223 | 0.78 |
| Ariyalur | 860,579 | 754,894 | 1.05 |
| Cuddalore | 2,970,742 | 2,605,914 | 3.61 |
| Nagapattinam | 1,842,753 | 1,616,450 | 2.24 |
| Thiruvarur | 1,441,276 | 1,264,277 | 1.75 |
| Thanjavur | 2,742,715 | 2,405,890 | 3.33 |
| Pudukkottai | 1,844,913 | 1,618,345 | 2.24 |
| Sivaganga | 1,526,575 | 1,339,101 | 1.86 |
| Madurai | 3,463,607 | 3,038,252 | 4.21 |
| Theni | 1,420,325 | 1,245,899 | 1.73 |
| Virudhunagar | 2,214,208 | 1,942,288 | 2.69 |
| Ramanathapuram | 1,542,927 | 1,353,445 | 1.88 |
| Thoothukkudi | 1,995,201 | 1,750,176 | 2.43 |
| Tirunelveli | 3,508,046 | 3,077,233 | 4.27 |
| Kanniyakumari | 2,132,226 | 1,870,374 | 2.59 |
| Dharmapuri | 1,717,801 | 1,506,843 | 2.09 |
| Krishnagiri | 2,142,982 | 1,879,809 | 2.61 |
| Coimbatore | 3,942,171 | 3,458,045 | 4.79 |
| Tiruppur | 2,826,119 | 2,479,052 | 3.44 |
 India Population


