Telangana Population 2025
Telangana is the southern state in India, bordered by Andhra Pradesh to the south, Karnataka to the west, Maharashtra to the north and west, Chhattisgarh to the east. Telangana is the newly formed state carved out from Andhra Pradesh in 2014. 'Telinga', 'Telungalu', 'Tenugulu' means people of Telugu speaking, gradually called as Telangana. Telangana population in 2025 is estimated to be 39.2 million (3.91 Crores), By Aug 2023, Telangana population is projected to be 3.8 Crores as per Unique Identification Aadhar India, updated Jan 2024. As per NFHS 2019-2021 report, Total Fertility Rate of Telangana State is 1.8 children per women compared to 1.9 in 2016. Hyderabad is the state capital of Telangana.
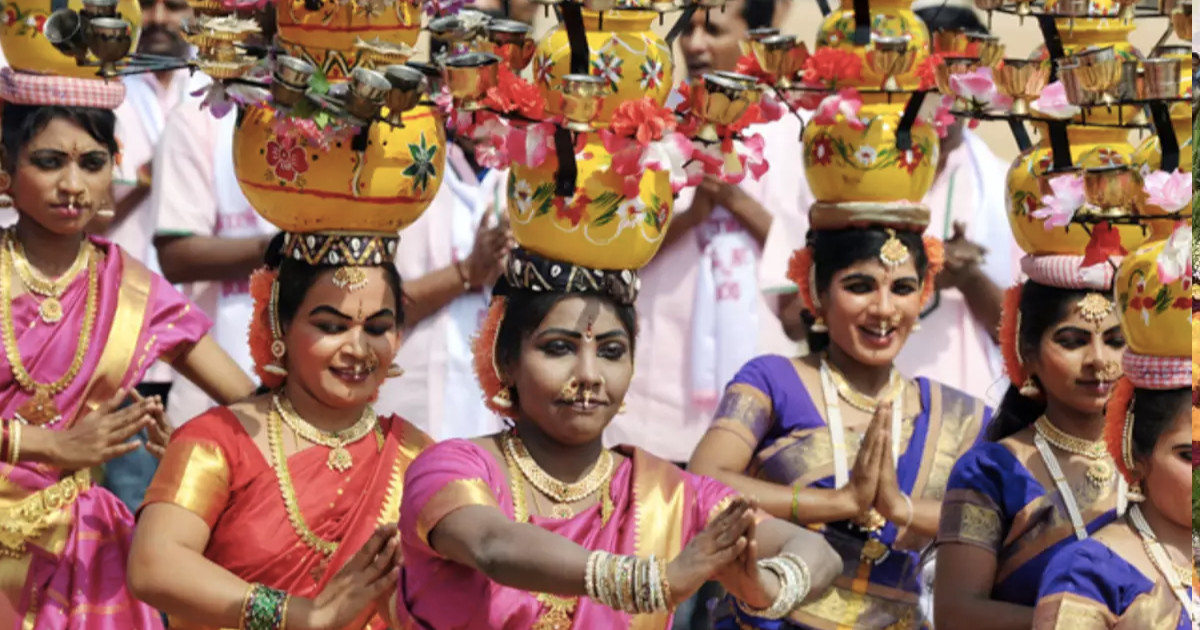
Image Source: Telangana people gathering for Bathukamma
The census in 2011 was conducted in the joint state of Andhra pradesh, 84.58 million was recorded for the telugu speaking states of Telangana and Andhra. 35 million is from Telangana, 35,286,757 in 2011. Telangana population will be 35286757 by 2021 in the next census. Telangana was seperated from Andhra Pradesh 10 districts including Hyderabad City. 23 new districts were created on which lead to total of 33 districts in Telangana. Below is the Telangana district wise population as per Census 2011 and 2020 projection.
| slno | Name | Headquarters | Area in sq.km. | Population (2011) | Total Mandals | Density per sq km |
|---|---|---|---|---|---|---|
| 1 | Adilabad | Adilabad | 4,153 | 7,08,972 | 18 | 171 |
| 2 | Bhadradri Kothagudem | Kothagudem | 7,483 | 10,69,261 | 23 | 143 |
| 3 | Hyderabad | Hyderabad | 217 | 39,43,323 | 16 | 18172 |
| 4 | Jagitial | Jagitial | 2,419 | 9,85,417 | 18 | 407 |
| 5 | Jangaon | Jangaon | 2,188 | 5,66,376 | 13 | 259 |
| 6 | Jayashankar Bhupalapally | Bhupalpalle | 6,175 | 7,11,434 | 20 | 115 |
| 7 | Jogulamba Gadwal | Gadwal | 2,928 | 6,09,990 | 12 | 208 |
| 8 | Kamareddy | Kamareddy | 3,652 | 9,72,625 | 22 | 266 |
| 9 | Karimnagar | Karimnagar | 2,128 | 10,05,711 | 16 | 473 |
| 10 | Khammam | Khammam | 4,361 | 14,01,639 | 21 | 321 |
| 11 | Kumarambheem Asifabad | Asifabad | 4,878 | 5,15,812 | 15 | 106 |
| 12 | Mahabubabad | Mahabubabad | 2,877 | 7,74,549 | 16 | 269 |
| 13 | Mahabubnagar | Mahabubnagar | 5,285 | 14,86,777 | 26 | 281 |
| 14 | Mancherial district | Mancherial | 4,016 | 8,07,037 | 18 | 201 |
| 15 | Medak | Medak | 2,786 | 7,67,428 | 20 | 275 |
| 16 | Medchal-Malkajgiri | Shamirpet | 1,084 | 24,40,073 | 14 | 2251 |
| 17 | Mulugu | Mulugu | 3,881 | 2,94,671 | 9 | 124 |
| 18 | Nagarkurnool | Nagarkurnool | 6,545 | 8,93,308 | 22 | 142 |
| 19 | Narayanpet | Narayanpet | 11 | |||
| 20 | Nalgonda | Nalgonda | 7,122 | 16,18,416 | 31 | 227 |
| 21 | Nirmal | Nirmal | 3,845 | 7,09,418 | 19 | 185 |
| 22 | Nizamabad | Nizamabad | 4,288 | 15,71,022 | 27 | 366 |
| 23 | Peddapalli | Peddapalli | 2,236 | 7,95,332 | 14 | 356 |
| 24 | Rajanna Sircilla | Sircilla | 2,019 | 5,52,037 | 13 | 273 |
| 25 | Ranga Reddy | Shamshabad | 5,031 | 24,46,265 | 27 | 486 |
| 26 | Sangareddy | Sangareddy | 4,403 | 15,27,628 | 26 | 347 |
| 27 | Siddipet | Siddipet | 3,632 | 10,12,065 | 22 | 279 |
| 28 | Suryapet | Suryapet | 3,607 | 10,99,560 | 23 | 305 |
| 29 | Vikarabad | Vikarabad | 3,386 | 9,27,140 | 18 | 274 |
| 30 | Wanaparthy | Wanaparthy | 2,152 | 5,77,758 | 14 | 268 |
| 31 | Warangal Rural | Warangal | 2,175 | 7,18,537 | 15 | 330 |
| 32 | Warangal Urban | Warangal | 1,309 | 10,80,858 | 11 | 826 |
| 33 | Yadadri Bhuvanagiri | Bhongir | 3,092 | 7,39,448 | 16 | 239 |
Population Pyramid
Telangana population pyramid illustrates the below graph, with the wide base suggests growing population, with a narrow base indicates declining birth rates.
Telangana Population by Religion
As per the 2014 Telangana state survey, Telangana population religion wise, 85% of the population follow Hinduism, 12.6% are Muslim population, 1.3% are Christians and Sikhs, Jains and Buddhists represent a total of 1%. The Sikh people are 30,340 which is 0.04% whereas the Jains are 26,690 which constitutes 0.075%. Telangana has 30 million Hindu population and 4.4 million Muslim population, GHMC has the largest Muslim population whereas Khammam has the lowest population of the Muslims in Telangana state. Christians are 447,124, The largest concentration of the Christians is in Hyderabad and their least population is in Adilabad district. Source: Details of Religion In Main Table C-1- 2011 (India & States/UTs)
Ethnic groups of Telangana
1. Gond-Kolam Region - the tribal areas of Adilabad district.
2. Khond-Savara Region - Tribal areas of Karimnagar, Warangal and Khammam.
3. Chenchu Region - Tribal areas of Mahboobnagar and Nalgonda districts.
4. The Konda Reddis are inhabiting on either side of Godavari banks from Bhadrachalam area of Khammam district.
2011 census of Telangana Tribes and their population.
| Tribes | Population as per Census 2011 |
|---|---|
| Andh, Sadhu Andh | 12,882 |
| Bagata | 850 |
| Bhil | 535 |
| Chenchu | 16,912 |
| Gadabas, Bodo Gadaba, Gutob Gadaba, Kallayi Gadaba, Parangi Gadaba, Kathera Gadaba, Kapu Gadaba | 283 |
| Gond, Naikpod, Rajgond, Koitur | 297,910 |
| Generic Tribes etc. | 160,839 |
| Hill Reddis | 256 |
| Jatapus | 180 |
| Kammara | 5,251 |
| Kattunayakan | 93 |
| Kolam, Kolawar | 44,805 |
| Konda Dhoras, Kubi | 580 |
| Konda Kapus | 2,571 |
| Kondareddis | 16,810 |
| Kondhs, Kodi, Kodhu, Desaya Kondhs, Dongria Kondhs, Kuttiya Kondhs, Tikiria Kondhs, Yenity Kondhs, Kuvinga | 912 |
| Kotia, Bentho Oriya, Bartika, Dulia, Holva, Sanrona, Sidhopaiko | 374 |
| Koya, Doli Koya, Gutta Koya, Kammara Koya, Musara Koya, Oddi Koya, Pattidi Koya, Rajah, Rasha Koya, Lingadhari Koya (ordinary), Kottu Koya, Bhine Koya, Rajkoya | 486,391 |
| Kulia | 290 |
| Malis | 49 |
| Manna Dhora | 4,393 |
| Mukha Dhora, Nooka Dhora | 63 |
| Nakkala, Kurvikaran | 1,149 |
| Nayaks (in the Agency tracts) | 6,366 |
| Pardhan | 24,776 |
| Porja, Parangiperja | 357 |
| Reddi Dhoras | 50 |
| Rona, Rena | 72 |
| Savaras, Kapu Savaras, Maliya Savaras, Khutto Savaras | 1,811 |
| Sugalis, Lambadis, Banjara | 2,046,117 |
| Thoti (in Adilabad, Hyderabad, Karimnagar, Khammam, Mahbubnagar, Medak, Nalgonda, Nizamabad and Warangal districts) | 4,811 |
| Yenadis, Chella Yenadi, Kappala Yenadi, Manchi Yenadi, Reddi Yenadi | 4,062 |
| Yerukulas, Koracha, Dabba Yerukula, Kunchapuri Yerukula, Uppu Yerukula | 144,128 |
Literacy rate in Telangana
The lowest literacy rate is 49.87% in Jogulamba Gadwal and the highest literacy district is Hyderabad with 83.25%.
| slno | Name | Literacy % | Sex Ratio |
|---|---|---|---|
| 1 | Adilabad | 63.46 | 978 |
| 2 | Bhadradri Kothagudem | 66.4 | 1008 |
| 3 | Hyderabad | 83.25 | 954 |
| 4 | Jagitial | 60.26 | 1036 |
| 5 | Jangaon | 61.44 | 997 |
| 6 | Jayashankar Bhupalapally | 60.33 | 1009 |
| 7 | Jogulamba Gadwal | 49.87 | 972 |
| 8 | Kamareddy | 56.51 | 1033 |
| 9 | Karimnagar | 69.16 | 993 |
| 10 | Khammam | 65.95 | 1005 |
| 11 | Kumarambheem Asifabad | 56.72 | 998 |
| 12 | Mahabubabad | 57.13 | 996 |
| 13 | Mahabubnagar | 56.78 | 995 |
| 14 | Mancherial | 64.35 | 977 |
| 15 | Medak | 56.12 | 1027 |
| 16 | Medchal-Malkajgiri | 82.49 | 957 |
| 17 | Mulugu | 70.38 | 968 |
| 18 | Nagarkurnool | 56.78 | 995 |
| 19 | Narayanpet | 56.78 | 995 |
| 20 | Nalgonda | 63.75 | 978 |
| 21 | Nirmal | 57.77 | 1046 |
| 22 | Nizamabad | 64.25 | 1044 |
| 23 | Peddapalli | 65.52 | 992 |
| 24 | Rajanna Sircilla | 62.71 | 1014 |
| 25 | Ranga Reddy | 71.95 | 950 |
| 26 | Sangareddy | 64.08 | 965 |
| 27 | Siddipet | 61.61 | 1008 |
| 28 | Suryapet | 64.11 | 996 |
| 29 | Vikarabad | 57.91 | 1001 |
| 30 | Wanaparthy | 55.67 | 960 |
| 31 | Warangal Rural | 61.26 | 994 |
| 32 | Warangal Urban | 76.17 | 997 |
| 33 | Yadadri Bhuvanagiri | 65.53 | 973 |
Languages spoken in Telangana
Telugu is the widely spoken language in Telangana, also it is the official language of Telangana and Urdu is the second official language of the state. 77% of the total population of Telangana speak Telugu, 12% speak Urdu, and 13% speak other languages. Before 1948, Urdu was the official language of Telangana. Source: 2011 Census: Language and Mother Tongue
Telangana Population projection
Telangana population in 2022 is estimated to be 37.90 million (3.79 Crores), population in 2021 is estimated to be 37.72 million (3.77 Crores), According to UID, in 2020 is estimated to be 39.1 million (3.91 Crores), and population in 2023 is estimated to be 38.2 million.
 India Population


