Maharashtra Population 2026


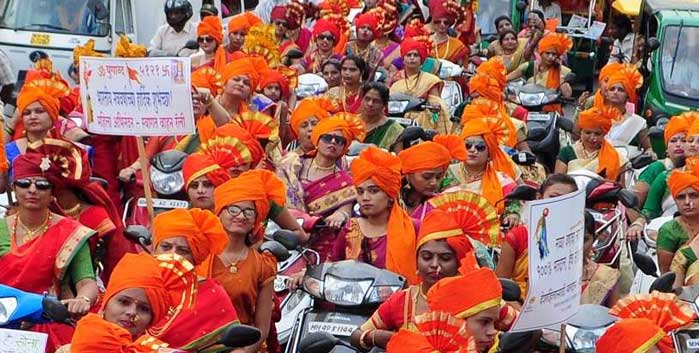
Image Source: Maharashtrians in traditional dress celebrate Gudi Padwa, Bike rally in Mumbai
Maharashtra is the third most urbanized state among other states since before independence. As per 1901 census 19 million were recorded in the state. The average population growth was 24.81 for the fifty years after the Indian Census from 1951 - 2001. The population growth was decreased to 15.99% in 2011 while it was 22.73% compared to 2001.
| Census year | Persons | Absolute | Percentage | Males | Females |
|---|---|---|---|---|---|
| 1901 | 19,391,643 | - | - | 9,802,129 | 9,589,514 |
| 1911 | 21,474,523 | 2,082,880 | 10.74 | 10,922,671 | 10,551,852 |
| 1921 | 20,849,666 | -624,857 | -2.91 | 10,692,865 | 10,156,801 |
| 1931 | 23,959,300 | 3,109,634 | 14.91 | 12,305,958 | 11,653,342 |
| 1941 | 26,832,758 | 2,873,458 | 11.99 | 13,769,460 | 13,063,298 |
| 1951 | 32,002,564 | 5,169,806 | 19.27 | 16,490,039 | 15,512,525 |
| 1961 | 39,553,718 | 7,551,154 | 23.6 | 20,428,882 | 19,124,836 |
| 1971 | 50,412,235 | 10,858,517 | 27.45 | 26,116,351 | 24,295,884 |
| 1981 | 62,782,818 | 12,370,583 | 24.54 | 32,414,432 | 30,368,386 |
| 1991 | 78,937,187 | 16,154,369 | 25.73 | 40,825,618 | 38,111,569 |
| 2001 | 96,878,627 | 17,941,440 | 22.73 | 50,400,596 | 46,478,031 |
| 2011 | 112,374,333 | 15,495,706 | 15.99 | 58,243,056 | 54,131,277 |
Population Pyramid
Maharashtra Population by Religion
Hindu is the largest religion in Maharashtra religion wise population with 79.83% of 89 million population, followed by Muslim with 11.54% of 12.9 million, 5.81% with Buddhism of 6.5 million and other 2.82% is shared by other religions like Christianity(0.96%), Sikhism(0.2%) and Jainism(1.25%). The total Muslim population is 12.9 Million is the second largest after Hindu 89.7 Million, followed by Buddhist Jains of 1.4 Millions, Christians of 1 Million, Sikhs with 223,247 and 6.5 Millions.
| Religion | Persons | Percentage | Males | Females |
|---|---|---|---|---|
| Hindu | 89,703,057 | 79.83 | 46,535,862 | 43,167,195 |
| Muslim | 12,971,152 | 11.54 | 6,789,127 | 6,182,025 |
| Christian | 1,080,073 | 0.96 | 531,916 | 548,157 |
| Sikh | 223,247 | 0.20 | 118,058 | 105,189 |
| Buddhist | 6,531,200 | 5.81 | 3,314,906 | 3,216,294 |
| Jain | 1,400,349 | 1.25 | 713,157 | 687,192 |
| Others | 178,965 | 0.16 | 89,823 | 89,142 |
| Not Stated | 286,290 | 0.25 | 150,207 | 136,083 |
Ethnic groups of Maharashtra
| Tribes | Population as per Census 2011 |
|---|---|
| All Scheduled Tribes | 10,510,213 |
| Andh | 474,110 |
| Baiga | 333 |
| Barda | 1,247 |
| Bavacha, Bamcha | 345 |
| Bhaina | 270 |
| Bharia Bhumia, Bhuinhar Bhumia, Pando | 1,348 |
| Bhattra | 66 |
| Bhil, Bhil Garasia, Dholi Bhil, Dungri Bhil, Dungri Garasia, Mewasi Bhil, Rawal Bhil, Tadvi Bhil, Bhagalia, Bhilala, Pawra, Vasava, Vasave | 2,588,659 |
| Bhunjia | 2,136 |
| Binjhwar | 8,567 |
| Birhul, Birhor | 145 |
| Dhanka, Tadvi, Tetaria, Valvi | 35,104 |
| Dhanwar | 4,094 |
| Dhodia | 17,520 |
| Dubla, Talavia, Halpati | 18,697 |
| Gamit, Gamta, Gavit, Mavchi, Padvi | 67,796 |
| Gond, Rajgond, Arakh, Arrakh, Agaria, Asur, Badi Maria, Bada Maria, Bhatola, Bhimma, Bhuta, Koilabhuta, Koilabhuti, Bhar, Bisonhorn Maria, Chota Maria, Dandami Maria, Dhuru, Dhurwa, Dhoba, Dhulia, Dorla, Gaiki, Gatta, Gatti, Gaita, Gond Gowari, Hill Maria, Kandra, Kalanga, Khatola, Koitar, Koya, Khirwar, Khirwara, Kucha Maria, Kuchaki Maria, Madia, Maria, Mana, Mannewar, Moghya, Mogia, Monghya, Mudia, Muria, Nagarchi, Naikpod, Nagwanshi, Ojha, Raj, Sonjhari Jhareka, Thatia, Thotya, Wade Maria, Vade Maria | 1,618,090 |
| Halba, Halbi | 261,011 |
| Kamar | 1,391 |
| Kathodi, Katkari, Dhor Kathodi, Dhor Kathkari, Son Kathodi, Son Katkari | 285,334 |
| Kawar, Kanwar, Kaur, Cherwa, Rathia, Tanwar, Chattri | 26,354 |
| Khairwar | 1,843 |
| Kharia | 745 |
| Kokna, Kokni, Kukna | 687,431 |
| Kol | 6,874 |
| Kolam, Mannervarlu | 194,671 |
| Koli Dhor, Tokre Koli, Kolcha, Kolgha | 220,074 |
| Koli Mahadev, Dongar Koli | 1,459,565 |
| Koli Malhar | 282,868 |
| Kondh, Khond, Kandh | 515 |
| Korku, Bopchi, Mouasi, Nihal, Nahul, Bondhi, Bondeya | 264,492 |
| Koya, Bhine Koya, Rajkoya | 388 |
| Nagesia, Nagasia | 133 |
| Naikda, Nayaka, Cholivala Nayaka, Kapadia Nayaka, Mota Nayaka, Nana Nayaka | 22,307 |
| Oraon, Dhangad | 43,060 |
| Pardhan, Pathari, Saroti | 145,131 |
| Pardhi, Advichincher, Phans Pardhi, Phanse Pardhi, Langoli Pardhi, Bahelia, Bahellia, Chita Pardhi, Shikari, Takankar, Takia | 223,527 |
| Parja | 315 |
| Patelia | 2,574 |
| Pomla | 44 |
| Rathawa | 488 |
| Sawar, Sawara | 348 |
| Thakur, Thakar, Ka Thakur, Ka Thakar, Ma Thakur, Ma Thakar | 567,968 |
| Varli | 796,245 |
| Vitolia, Kotwalia, Barodia | 448 |
| Generic Tribes etc. | 175,542 |
Literacy rate in Maharashtra
As per the census 2011, literacy rate in the Maharashtra State is 82.3% against 74% at national level. It is 88.4% and 75.9% for males and females respectively. At national level, it is 82.14% for males and 65.46% for females.
Languages spoken in Maharashtra
Marathi is the largest language speakers in Maharashtra State with 68.9%, total 77 million people speak the language followed by Hindi with 14 million(12.8%) and Urdu with 7.5 million(6.7%). Other 11.6% shares with many other Indian languages due to other and neighboring states migration. Gujarati's and Bhili's are more than 2 million each, Khandeshi, Telugu and Kannnada are more than 1 million each speaks their native language.
| Languages | Persons | Percentage | Rural | Urban |
|---|---|---|---|---|
| Marathi | 77,461,172 | 68.9314 | 49,974,030 | 27,487,142 |
| Hindi | 14,481,513 | 12.8869 | 4,064,495 | 10,417,018 |
| Urdu | 7,540,324 | 6.7100 | 1,640,718 | 5,899,606 |
| Gujarati | 2,371,743 | 2.1106 | 132,149 | 2,239,594 |
| Bhili | 2,247,678 | 2.0002 | 2,081,279 | 166,399 |
| Khandeshi | 1,616,730 | 1.4387 | 1,441,715 | 175,015 |
| Telugu | 1,320,880 | 1.1754 | 410,747 | 910,133 |
| Kannada | 1,000,463 | 0.8903 | 511,484 | 488,979 |
| Sindhi | 723,748 | 0.6441 | 18,833 | 704,915 |
| Tamil | 509,887 | 0.4537 | 20,246 | 489,641 |
| Gondi | 458,806 | 0.4083 | 424,148 | 34,658 |
| Bengali | 442,090 | 0.3934 | 87,120 | 354,970 |
| Konkani | 399,255 | 0.3553 | 158,796 | 240,459 |
| Malayalam | 366,153 | 0.3258 | 15,225 | 350,928 |
| Punjabi | 280,192 | 0.2493 | 11,842 | 268,350 |
| Korku | 255,772 | 0.2276 | 249,636 | 6,136 |
| Odia | 139,241 | 0.1239 | 13,738 | 125,503 |
| Tulu | 120,072 | 0.1069 | 2,605 | 117,467 |
| English | 106,656 | 0.0949 | 1,848 | 104,808 |
| Santali | 103,456 | 0.0921 | 102,261 | 1,195 |
| Kolami | 89,170 | 0.0794 | 87,528 | 1,642 |
| Nepali | 75,683 | 0.0673 | 8,367 | 67,316 |
| Maithili | 46,996 | 0.0418 | 2,591 | 44,405 |
| Halabi | 24,950 | 0.0222 | 8,543 | 16,407 |
| Assamese | 12,842 | 0.0114 | 2,520 | 10,322 |
| Kashmiri | 8,274 | 0.0074 | 1,551 | 6,723 |
| Kurukh/Oraon | 8,239 | 0.0073 | 6,778 | 1,461 |
| Lahnda | 7,271 | 0.0065 | 4,402 | 2,869 |
| Sanskrit | 3,802 | 0.0034 | 247 | 3,555 |
| Manipuri | 3,475 | 0.0031 | 215 | 3,260 |
Disability
Below table illustrates the disable population stats of Maharashtra.
| Type of disability | Total Persons | Cultivators | Agriculture labor | HHI | Other workers |
|---|---|---|---|---|---|
| Total disabled population | 1,248,337 | 288,569 | 341,799 | 37,672 | 580,297 |
| In Seeing | 241,873 | 55,581 | 69,381 | 6,742 | 110,169 |
| In Hearing | 210,863 | 45,744 | 53,476 | 6,757 | 104,886 |
| In Speech | 248,720 | 62,613 | 54,156 | 6,558 | 125,393 |
| In Movement | 240,071 | 58,526 | 72,619 | 8,055 | 100,871 |
| Mental Retardation | 31,327 | 7,509 | 10,473 | 882 | 12,463 |
| Mental Illness | 14,342 | 3,778 | 5,648 | 345 | 4,571 |
| Any Other | 226,358 | 46,348 | 64,361 | 7,100 | 108,549 |
| Multiple disability | 34,783 | 8,470 | 11,685 | 1,233 | 13,395 |
Maharashtra Population projection
According to UID, Maharashtra population in 2022 is estimated to be 125.5 Million (12.55 Crores), in 2021 is estimated to be 124.7 Million (12.47 Crores), and in 2020 is estimated to be 123 Million (12.3 Crores) and population in 2023 is estimated to be 126.5 Million.
Income Distribution
The rural population of the State living in 40,959 villages was 55 percent with agriculture as the key income area, major crops are Jowar, Wheat, Cereals, Cotton and Sugarcane. Maharashtra districts has many industrial corridors, Services sector being the largest share of 51.1%, followed by manufacturing industry sector with 31% and agriculture with 17.9% are the income areas for the state.
District wise population in Maharashtra
Maharashtra has 36 districts, divided into six revenue divisions for administrative purposes including Pune, Konkan, Aurangabad, Nashik, Amravati and Nagpur. Thane district is having the highest population with 12 million, followed by Mumbai Suburban and Pune with 10 million each. Below is the Maharashtra district wise population as per Census 2011 and 2020 projection. By 2011 55% is the rural population living in towns, villages and 45% is the urban population living in cities, currently there are 355 tehsils and 534 towns in this state. Total 40,959 are Inhabited Villages and 2706 are Un-Inhabited villages of the total population.
| District | Population(2020 est.) | Population(2011) | Percentage |
|---|---|---|---|
| Nandurbar | 1,879,056 | 1,648,295 | 1.47 |
| Dhule | 2,337,983 | 2,050,862 | 1.83 |
| Jalgaon | 4,822,105 | 4,229,917 | 3.76 |
| Buldana | 2,948,334 | 2,586,258 | 2.30 |
| Akola | 2,067,853 | 1,813,906 | 1.61 |
| Washim | 1,364,762 | 1,197,160 | 1.07 |
| Amravati | 3,292,827 | 2,888,445 | 2.57 |
| Wardha | 1,482,882 | 1,300,774 | 1.16 |
| Nagpur | 5,305,070 | 4,653,570 | 4.14 |
| Bhandara | 1,368,381 | 1,200,334 | 1.07 |
| Gondiya | 1,507,658 | 1,322,507 | 1.18 |
| Gadchiroli | 1,223,154 | 1,072,942 | 0.95 |
| Chandrapur | 2,512,910 | 2,204,307 | 1.96 |
| Yavatmal | 3,160,477 | 2,772,348 | 2.47 |
| Nanded | 3,831,873 | 3,361,292 | 2.99 |
| Hingoli | 1,342,173 | 1,177,345 | 1.05 |
| Parbhani | 2,093,138 | 1,836,086 | 1.63 |
| Jalna | 2,233,312 | 1,959,046 | 1.74 |
| Aurangabad | 4,219,461 | 3,701,282 | 3.29 |
| Nashik | 6,962,193 | 6,107,187 | 5.43 |
| Thane | 12,608,569 | 11,060,148 | 9.84 |
| Mumbai Suburban | 10,666,937 | 9,356,962 | 8.33 |
| Mumbai | 3,517,369 | 3,085,411 | 2.75 |
| Raigarh | 3,002,988 | 2,634,200 | 2.34 |
| Pune | 10,749,525 | 9,429,408 | 8.39 |
| Ahmadnagar | 5,179,201 | 4,543,159 | 4.04 |
| Bid | 2,946,956 | 2,585,049 | 2.30 |
| Latur | 2,797,783 | 2,454,196 | 2.18 |
| Osmanabad | 1,889,637 | 1,657,576 | 1.48 |
| Solapur | 4,922,242 | 4,317,756 | 3.84 |
| Satara | 3,424,265 | 3,003,741 | 2.67 |
| Ratnagiri | 1,841,179 | 1,615,069 | 1.44 |
| Sindhudurg | 968,602 | 849,651 | 0.76 |
| Kolhapur | 4,418,641 | 3,876,001 | 3.45 |
| Sangli | 3,217,243 | 2,822,143 | 2.51 |
 India Population


