Madhya Pradesh Population 2026
Madhya Pradesh is the state in central India, borders Maharashtra to the south, Chhattisgarh to the east, Gujarat and Rajasthan to the west, Uttar Pradesh to the north. Madhya Pradesh population in 2026 is estimated to be 86.7 million (8.67 Crores), By Aug 2023, Madhya Pradesh population is projected to be 8.65 Crores as per Unique Identification Aadhar India, updated 31, May 2023. As per NFHS 2019-2021 report, Total Fertility Rate of Madhya Pradesh State is 2 children per women compared to 2.3 in 2016.
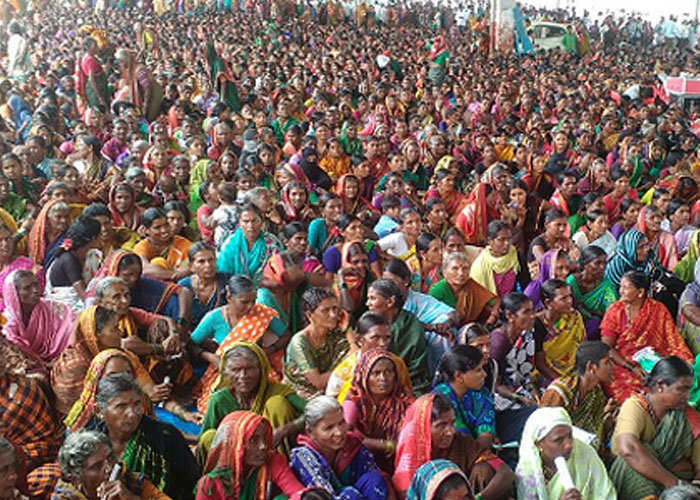
Image Source: People gathering for PACS orientation programme in rural Madhya Pradesh
| Census year | Persons | Absolute | Percentage | Males | Females |
|---|---|---|---|---|---|
| 1901 | 12,679,214 | - | - | 6,429,374 | 6,249,840 |
| 1911 | 14,249,382 | 1,570,168 | 12.38 | 7,245,404 | 7,003,978 |
| 1921 | 13,906,774 | -342,608 | -2.4 | 7,133,621 | 6,773,153 |
| 1931 | 15,326,879 | 1,420,105 | 10.21 | 7,871,541 | 7,455,338 |
| 1941 | 17,175,722 | 1,848,843 | 12.06 | 8,825,634 | 8,350,088 |
| 1951 | 18,614,931 | 1,439,209 | 8.38 | 9,571,722 | 9,043,209 |
| 1961 | 23,217,910 | 4,602,979 | 24.73 | 12,020,106 | 11,197,804 |
| 1971 | 30,016,625 | 6,798,715 | 29.28 | 15,630,250 | 14,386,375 |
| 1981 | 38,168,507 | 8,151,882 | 27.16 | 19,866,607 | 18,301,900 |
| 1991 | 48,566,242 | 10,397,735 | 27.24 | 25,394,673 | 23,171,569 |
| 2001 | 60,348,023 | 11,781,781 | 24.26 | 31,443,652 | 28,904,371 |
| 2011 | 72,626,809 | 12,278,786 | 20.35 | 37,612,306 | 35,014,503 |
Population Pyramid
Madhya Pradesh Population by Religion
Madhya Pradesh state religion wise population, Hinduism is the major religion, Hindu's population account for 90.8%, followed by Muslim with 6.5%. Christian, Buddhism, Jainism are the accounted less than 1%. 697,219 people has not stated their religion according to 2011 census. The Muslim population is the second largest with 4.7 Million after Hindu's majority, followed by Sikhs, Jains, Buddhists and Christians accounts for around 1 Million.
| Religion | Persons | Percentage | Males | Females |
|---|---|---|---|---|
| Hindu | 66,007,121 | 90.89 | 34,225,297 | 31,781,824 |
| Muslim | 4,774,695 | 6.57 | 2,454,832 | 2,319,863 |
| Christian | 213,282 | 0.29 | 105,297 | 107,985 |
| Sikh | 151,412 | 0.21 | 80,341 | 71,071 |
| Buddhist | 216,052 | 0.30 | 109,813 | 106,239 |
| Jain | 567,028 | 0.78 | 291,937 | 275,091 |
| Others | 599,594 | 0.83 | 296,614 | 302,980 |
| Not Stated | 97,625 | 0.13 | 48,175 | 49,450 |
Ethnic groups of Madhya Pradesh
| Tribes | Population as per Census 2011 |
|---|---|
| All Scheduled Tribes | 15,316,784 |
| Agariya | 41,243 |
| Andh | 137 |
| Baiga | 414,526 |
| Bhaina | 6,357 |
| Bharia Bhumia, Bhuinhar Bhumia, Bhumiya, Bharia, Paliha, Pando | 193,230 |
| Bhattra | 1,155 |
| Bhil, Bhilala, Barela, Patelia | 5,993,921 |
| Bhil Mina | 2,244 |
| Bhunjia | 1,469 |
| Biar, Biyar | 10,452 |
| Binjhwar | 15,805 |
| Birhul, Birhor | 52 |
| Damor, Damaria | 1,815 |
| Dhanwar | 2,175 |
| Gadaba, Gadba | 578 |
| Gond, Arakh, Arrakh, Agaria, Asur, Badi Maria, Bada Maria, Bhatola, Bhimma, Bhuta, Koilabhuta, Koliabhuti, Bhar, Bisonhorn Maria, Chota Maria, Dandami Maria, Dhuru, Dhurwa, Dhoba, Dhulia, Dorla, Gaiki, Gatta, Gatti, Gaita, Gond Gowari, Hill Maria, Kandra, Kalanga, Khatola, Koitar, Koya, Khirwar, Khirwara, Kucha Maria, Kuchaki Maria, Madia, Maria, Mana, Mannewar, Moghya, Mogia, Monghya, Mudia, Muria, Nagarchi, Nagwanshi, Ojha, Raj, Sonjhari, Jhareka, Thatia, Thotya, Wade Maria, Vade Maria, Daroi | 5,093,124 |
| Halba,Halbi | 14,438 |
| Kamar | 666 |
| Karku | 265 |
| Kawar, Kanwar, Kaur, Cherwa, Rathia, Tanwar, Chattri | 18,603 |
| Khairwar, Kondar | 76,097 |
| Kharia | 2,429 |
| Kondh, Khond, Kandh | 109 |
| Kol | 1,167,694 |
| Kolam | 224 |
| Korku, Bopchi, Mouasi, Nihal, Nahul, Bondhi, Bondeya | 730,847 |
| Korwa, Kodaku | 920 |
| Majhi | 50,655 |
| Majhwar | 443 |
| Mawasi | 109,180 |
| Munda | 5,041 |
| Nagesia, Nagasia | 359 |
| Oraon, Dhanka, Dhangad | 28,431 |
| Panika [in (i)Chhatarpur, Panna, Rewa, Satna, Shahdol, Umaria, Sidhi and Tikamgarh districts, and (ii) Sevda and Datia tehsils of Datia district)] | 97,767 |
| Pao | 44,312 |
| Pardhan, Pathari, Saroti | 123,742 |
| Pardhi, Bahelia, Bahellia, Chita Pardhi, Langoli Pardhi, Phans Pardhi, Shikari, Takankar, Takia [in (i) Chhindwara, Mandla, Dindori and Seoni districts, (ii) Baihar tehsil of Balaghat district, (iii) Betul, Bhainsdehi and Shahpur tahsils of Betul district, (iv) Patan tahsil and Sihora and Majholi blocks of Jabalpur disitrict, (v) Katni (Murwara) and Vijaya Raghogarh tahsils and Bahoriband and Dhemerkheda blocks of Katni district, (vi) Hoshangabad, Babai, Sohagpur, Pipariya and Bankhedi tahsils and Kesla block of Hoshangabad district, (vii) Narsinghpur district, and (viii) Harsud tahsil of Khandwa district] | 5,896 |
| Parja | 137 |
| Sahariya, Saharia, Seharia, Sehria, Sosia, Sor | 614,958 |
| Saonta, Saunta | 190 |
| Saur | 167,340 |
| Sawar, Sawara | 881 |
| Sonr | 12,905 |
| Generic Tribes etc. | 263,972 |
Languages spoken in Madhya Pradesh
| Languages | Persons | Percentage | Rural | Urban |
|---|---|---|---|---|
| Hindi | 64,324,963 | 88.5692 | 46,244,040 | 18,080,923 |
| Bhili | 3,587,810 | 4.9401 | 3,516,097 | 71,713 |
| Marathi | 1,231,285 | 1.6954 | 755,463 | 475,822 |
| Gondi | 1,164,290 | 1.6031 | 1,136,976 | 27,314 |
| Urdu | 916,608 | 1.2621 | 153,735 | 762,873 |
| Korku | 470,386 | 0.6477 | 466,695 | 3,691 |
| Sindhi | 245,161 | 0.3376 | 3,330 | 241,831 |
| Gujarati | 187,211 | 0.2578 | 77,751 | 109,460 |
| Punjabi | 139,658 | 0.1923 | 42,067 | 97,591 |
| Bengali | 109,185 | 0.1503 | 44,874 | 64,311 |
| Khandeshi | 37,882 | 0.0522 | 24,807 | 13,075 |
| Malayalam | 37,761 | 0.0520 | 3,162 | 34,599 |
| Telugu | 24,411 | 0.0336 | 3,927 | 20,484 |
| Tamil | 20,544 | 0.0283 | 2,026 | 18,518 |
| Odia | 18,765 | 0.0258 | 5,734 | 13,031 |
| Nepali | 8,724 | 0.0120 | 752 | 7,972 |
| Lahnda | 7,738 | 0.0107 | 6,805 | 933 |
| Kannada | 4,175 | 0.0057 | 1,762 | 2,413 |
| Kurukh/Oraon | 4,132 | 0.0057 | 1,092 | 3,040 |
| Maithili | 4,129 | 0.0057 | 953 | 3,176 |
| Korwa | 2,147 | 0.0030 | 2,023 | 124 |
Disability
| Type of disability | Total Persons | Cultivators | Agriculture labor | HHI | Other workers |
|---|---|---|---|---|---|
| Total disabled population | 613,921 | 169,627 | 232,762 | 22,542 | 188,990 |
| In Seeing | 106,335 | 30,154 | 40,558 | 3,597 | 32,026 |
| In Hearing | 118,663 | 33,555 | 43,206 | 4,419 | 37,483 |
| In Speech | 27,327 | 7,179 | 10,421 | 1,006 | 8,721 |
| In Movement | 170,753 | 48,032 | 61,857 | 6,511 | 54,353 |
| Mental Retardation | 20,680 | 5,375 | 9,421 | 669 | 5,215 |
| Mental Illness | 9,002 | 2,590 | 4,261 | 271 | 1,880 |
| Any Other | 135,786 | 35,127 | 52,109 | 5,117 | 43,433 |
| Multiple disability | 25,375 | 7,615 | 10,929 | 952 | 5,879 |
Madhya Pradesh Population projection
According to UID, Madhya Pradesh population in 2022 is estimated to be 85.6 million (8.56 Crores), in 2021 is estimated to be 84.5 million (8.45 Crores), and population in 2020 is estimated to be 85 million (8.5 Crores), and population in 2023 is estimated to be 86.6 million.
District wise population in Madhya Pradesh
Below is the Madhya Pradesh district wise population as per Census 2011 and 2020 projection. As on June 2019, there are 52 districts in Madhya Pradesh. The new district, Niwari was created in the end of 2018, partitioning Tikamgarh district of 173,420 people.
| District | Population(2020 est.) | Population(2011) | Percentage |
|---|---|---|---|
| Sheopur | 784,162 | 687,861 | 0.95 |
| Morena | 2,241,206 | 1,965,970 | 2.71 |
| Bhind | 1,941,426 | 1,703,005 | 2.34 |
| Gwalior | 2,316,521 | 2,032,036 | 2.80 |
| Datia | 896,900 | 786,754 | 1.08 |
| Shivpuri | 1,967,697 | 1,726,050 | 2.38 |
| Tikamgarh | 1,647,489 | 1,445,166 | 1.99 |
| Chhatarpur | 2,009,108 | 1,762,375 | 2.43 |
| Panna | 1,158,833 | 1,016,520 | 1.40 |
| Sagar | 2,711,442 | 2,378,458 | 3.27 |
| Damoh | 1,441,210 | 1,264,219 | 1.74 |
| Satna | 2,540,986 | 2,228,935 | 3.07 |
| Rewa | 2,696,221 | 2,365,106 | 3.26 |
| Umaria | 735,024 | 644,758 | 0.89 |
| Neemuch | 941,716 | 826,067 | 1.14 |
| Mandsaur | 1,528,069 | 1,340,411 | 1.85 |
| Ratlam | 1,658,779 | 1,455,069 | 2.00 |
| Ujjain | 2,265,025 | 1,986,864 | 2.74 |
| Shajapur | 1,724,456 | 1,512,681 | 2.08 |
| Dewas | 1,782,635 | 1,563,715 | 2.15 |
| Dhar | 2,491,804 | 2,185,793 | 3.01 |
| Indore | 3,735,435 | 3,276,697 | 4.51 |
| Khargone (West Nimar) | 2,135,272 | 1,873,046 | 2.58 |
| Barwani | 1,579,904 | 1,385,881 | 1.91 |
| Rajgarh | 1,762,228 | 1,545,814 | 2.13 |
| Vidisha | 1,663,118 | 1,458,875 | 2.01 |
| Bhopal | 2,703,010 | 2,371,061 | 3.26 |
| Sehore | 1,494,918 | 1,311,332 | 1.81 |
| Raisen | 1,518,021 | 1,331,597 | 1.83 |
| Betul | 1,795,913 | 1,575,362 | 2.17 |
| Harda | 650,330 | 570,465 | 0.79 |
| Hoshangabad | 1,415,139 | 1,241,350 | 1.71 |
| Katni | 1,472,928 | 1,292,042 | 1.78 |
| Jabalpur | 2,808,149 | 2,463,289 | 3.39 |
| Narsimhapur | 1,244,714 | 1,091,854 | 1.50 |
| Dindori | 803,157 | 704,524 | 0.97 |
| Mandla | 1,202,592 | 1,054,905 | 1.45 |
| Chhindwara | 2,383,651 | 2,090,922 | 2.88 |
| Seoni | 1,572,209 | 1,379,131 | 1.90 |
| Balaghat | 1,939,936 | 1,701,698 | 2.34 |
| Guna | 1,415,332 | 1,241,519 | 1.71 |
| Ashoknagar | 963,381 | 845,071 | 1.16 |
| Shahdol | 1,215,312 | 1,066,063 | 1.47 |
| Anuppur | 854,130 | 749,237 | 1.03 |
| Sidhi | 1,284,818 | 1,127,033 | 1.55 |
| Singrauli | 1,343,231 | 1,178,273 | 1.62 |
| Jhabua | 1,168,555 | 1,025,048 | 1.41 |
| Alirajpur | 831,059 | 728,999 | 1.00 |
| Khandwa (East Nimar) | 1,493,470 | 1,310,061 | 1.80 |
| Burhanpur | 863,946 | 757,847 | 1.04 |
 India Population


